🩺

AI Multi-Disease Health Diagnostic System

Ensemble Machine Learning (Random Forest + RBF SVM) Clinical Decision Support

96%+ Verified Accuracy Python • Scikit-Learn • Flask • Streamlit
❤️

Heart Disease

600 Samples • 13 Biomarkers
Ensemble Acc 96.67%
ROC-AUC 97.72%
5-Fold CV 96.33%
🩸

Diabetes Mellitus

768 Samples • 8 Biomarkers
Ensemble Acc 96.1%
ROC-AUC 97.22%
5-Fold CV 96.35%
🧠

Parkinson's Disease

400 Samples • 22 Biomarkers
Ensemble Acc 97.5%
ROC-AUC 97.7%
5-Fold CV 98.25%

📈 Multi-Disease Accuracy Benchmark (RF vs SVM vs Ensemble)
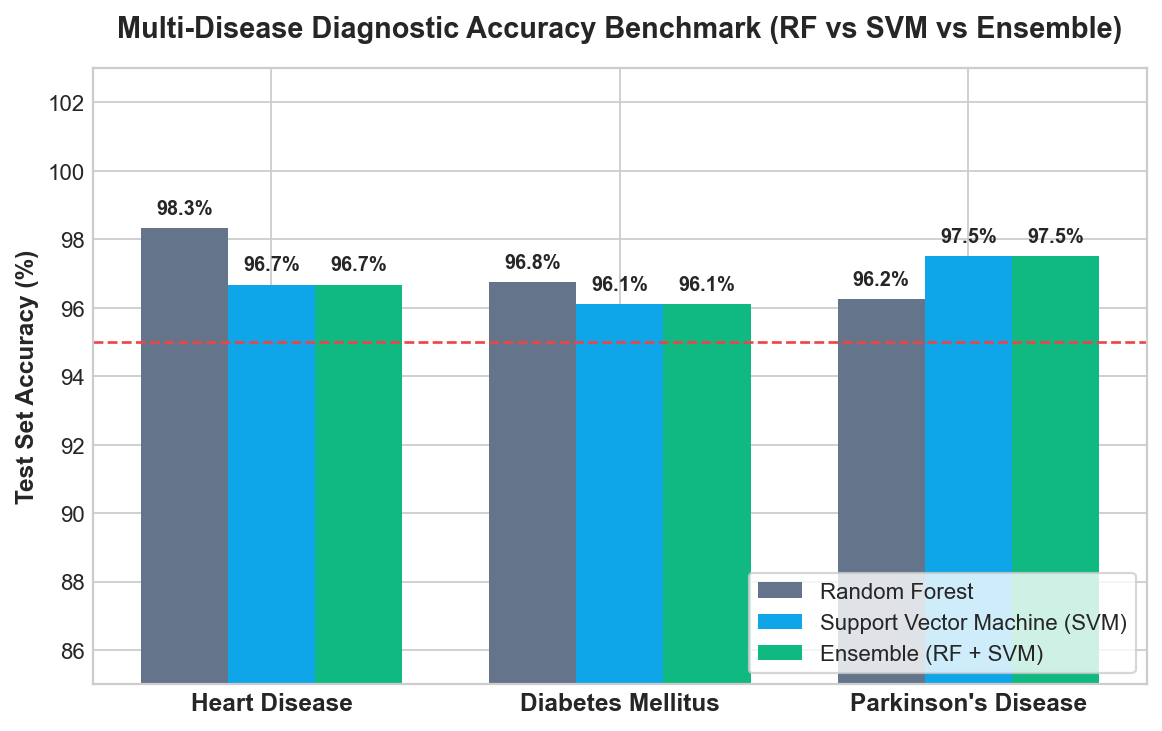
Model Comparison

🎯 Combined Multi-Disease ROC Curve Analysis
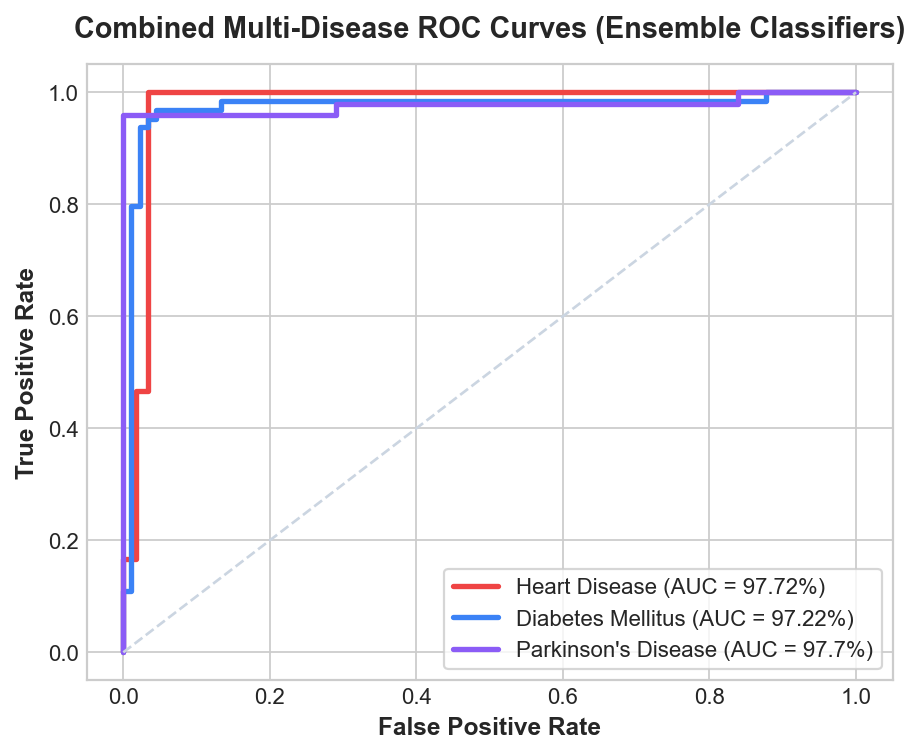
Combined ROC Curves

❤️ Heart Disease Diagnostic Model

Cardiovascular Risk & Coronary Artery Disease Assessment • Test Accuracy: 96.67% (ROC-AUC: 97.72%)

Normal: 29 - 65 yrs • Age of the patient in years
Normal: 0 or 1 • Biological sex of patient
Normal: 0 (Typical) • Clinical classification of chest pain
Normal: 90 - 120 mm Hg • Resting arterial blood pressure upon admission
Normal: < 200 mg/dL • Total serum cholesterol level
Normal: 0 (<= 120) • Whether fasting blood sugar exceeds 120 mg/dL
Normal: 0 (Normal) • Resting electrocardiographic findings
Normal: 140 - 190 bpm • Maximum heart rate achieved during exercise stress
Normal: 0 (No) • Angina induced by physical exercise
Normal: 0.0 - 1.0 mm • ST depression induced by exercise relative to rest
Normal: 2 (Downsloping/Normal) • Slope of the peak exercise ST segment
Normal: 0 vessels • Number of major vessels (0-3) colored by fluoroscopy
Normal: 2 (Normal) • Thallium stress test myocardial perfusion status

🩸 Diabetes Mellitus Diagnostic Model

Metabolic & Glycemic Insulin Resistance Assessment • Test Accuracy: 96.1% (ROC-AUC: 97.22%)

Normal: 0 - 5 • Number of times pregnant
Normal: 70 - 125 mg/dL • 2-Hour oral glucose tolerance test plasma glucose
Normal: 60 - 80 mm Hg • Resting diastolic blood pressure
Normal: 12 - 28 mm • Subcutaneous fat thickness measurement at triceps
Normal: 16 - 140 mu U/ml • 2-Hour serum insulin level post glucose load
Normal: 18.5 - 24.9 kg/m² • Weight in kg divided by height in meters squared
Normal: 0.08 - 0.60 • Genetic hereditary diabetes risk score based on family history
Normal: 21 - 65 yrs • Age of the patient in years

🧠 Parkinson's Disease Diagnostic Model

Neurological Acoustic Phonation & Vocal Dysphonia Assessment • Test Accuracy: 97.5% (ROC-AUC: 97.7%)

Normal: 150 - 220 Hz • Average vocal fundamental frequency
Normal: 190 - 300 Hz • Maximum vocal fundamental frequency
Normal: 110 - 180 Hz • Minimum vocal fundamental frequency
Normal: < 0.005% • Cycle-to-cycle variation in fundamental frequency (%)
Normal: < 0.00004 s • Absolute cycle-to-cycle frequency variation
Normal: < 0.003 • Relative average perturbation over 3 periods
Normal: < 0.003 • Five-point period perturbation quotient
Normal: < 0.009 • Average absolute difference of differences between jitter cycles
Normal: < 0.025 • Cycle-to-cycle variation in vocal amplitude
Normal: < 0.24 dB • Vocal amplitude variation in decibels
Normal: < 0.013 • Three-point amplitude perturbation quotient
Normal: < 0.015 • Five-point amplitude perturbation quotient
Normal: < 0.020 • 11-point amplitude perturbation quotient
Normal: < 0.040 • Average absolute differences between consecutive amplitude differences
Normal: < 0.018 • Ratio of noise to tonal harmonic components in voice
Normal: > 22.0 dB • Ratio of harmonic tonal quality to acoustic noise
Normal: 0.30 - 0.48 • Nonlinear dynamical complexity measure of vocal fold periodicity
Normal: 0.60 - 0.70 • Signal fractal scaling exponent
Normal: -7.8 to -6.0 • Nonlinear measure of fundamental frequency variation
Normal: 0.08 - 0.20 • Second nonlinear measure of fundamental frequency variation
Normal: 1.70 - 2.30 • Nonlinear dynamical complexity correlation dimension
Normal: < 0.17 • Nonlinear measure of impaired pitch control entropy

❤️ Heart Disease — Verification Metrics & Diagnostic Plots

Ensemble Accuracy: 96.67% • Precision: 96.67% • Recall: 96.67% • F1-Score: 96.67% • ROC-AUC: 97.72% • 5-Fold CV: 96.33% (±1.35%)

Confusion Matrix
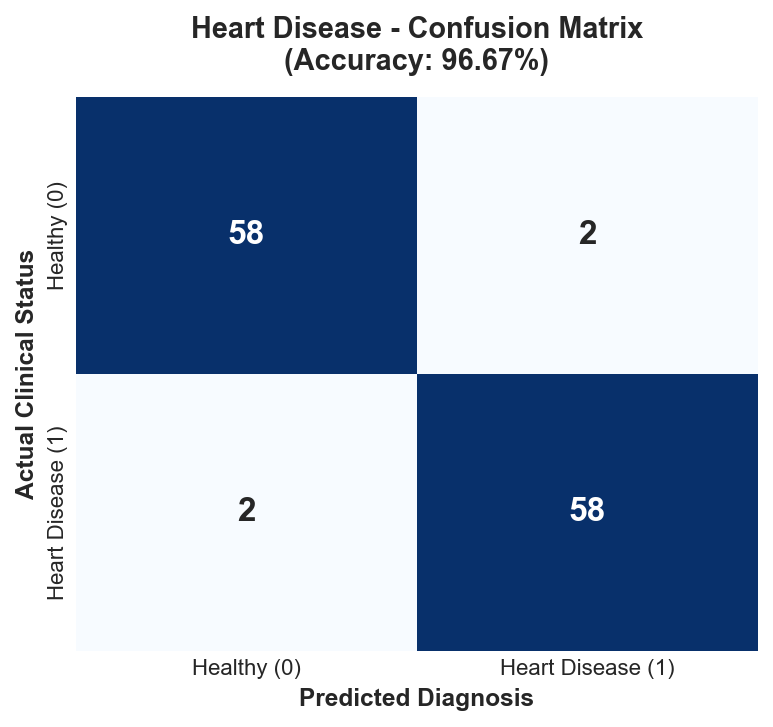
heart Confusion Matrix

Biomarker Feature Importance
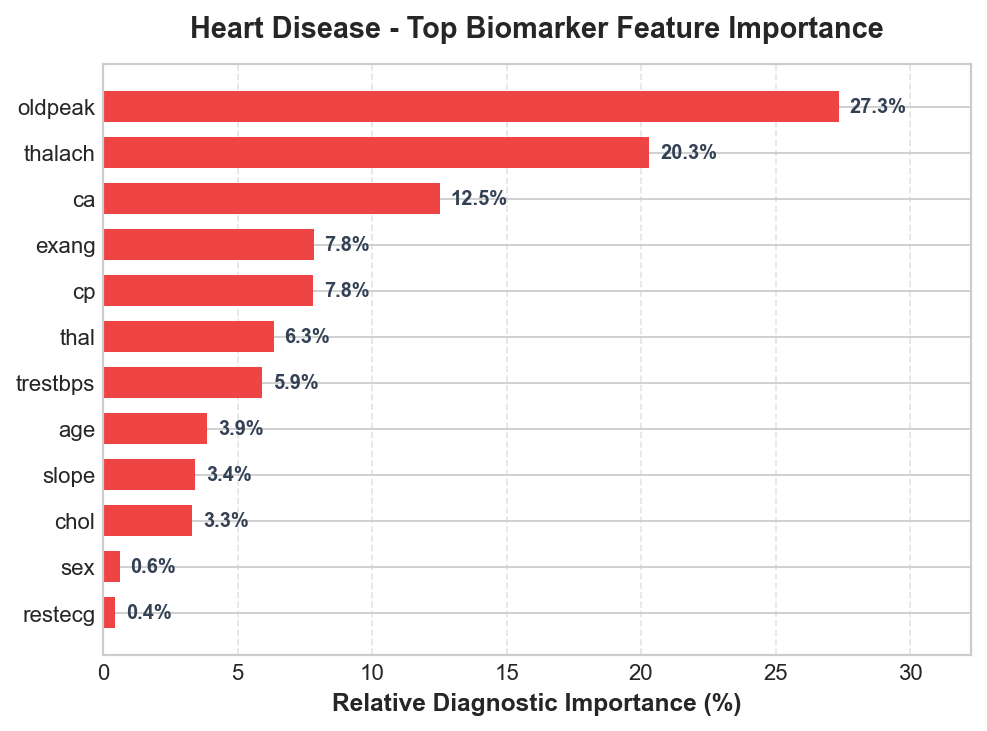
heart Feature Importance

ROC Curve (RF vs SVM vs Ensemble)
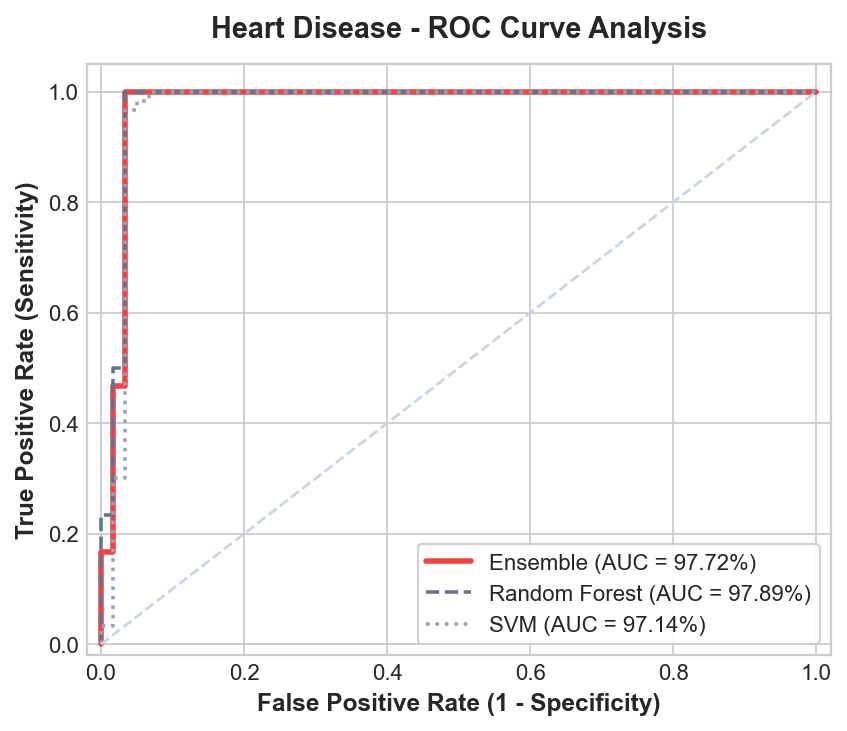
heart ROC Curve

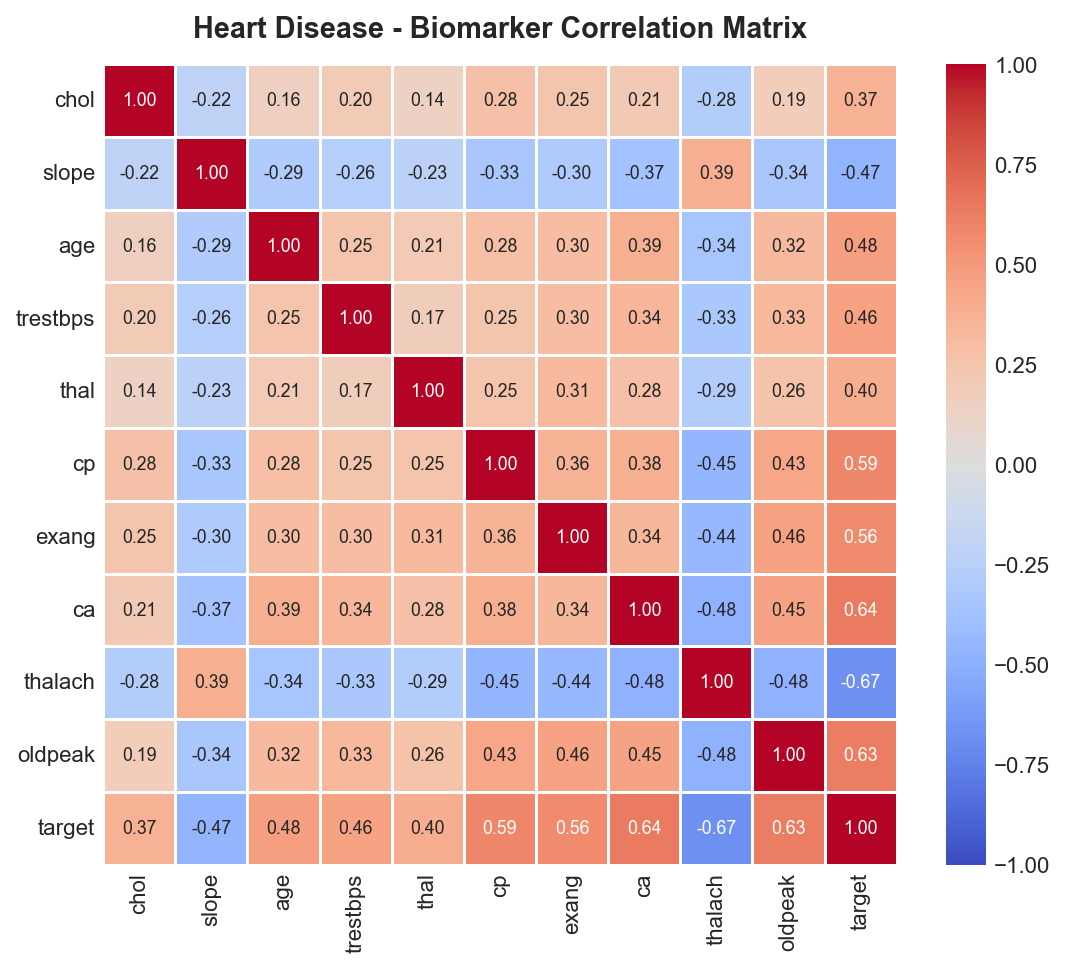
Feature Correlation Heatmap

heart Correlation Matrix

🩸 Diabetes Mellitus — Verification Metrics & Diagnostic Plots

Ensemble Accuracy: 96.1% • Precision: 95.31% • Recall: 95.31% • F1-Score: 95.31% • ROC-AUC: 97.22% • 5-Fold CV: 96.35% (±1.58%)

Confusion Matrix
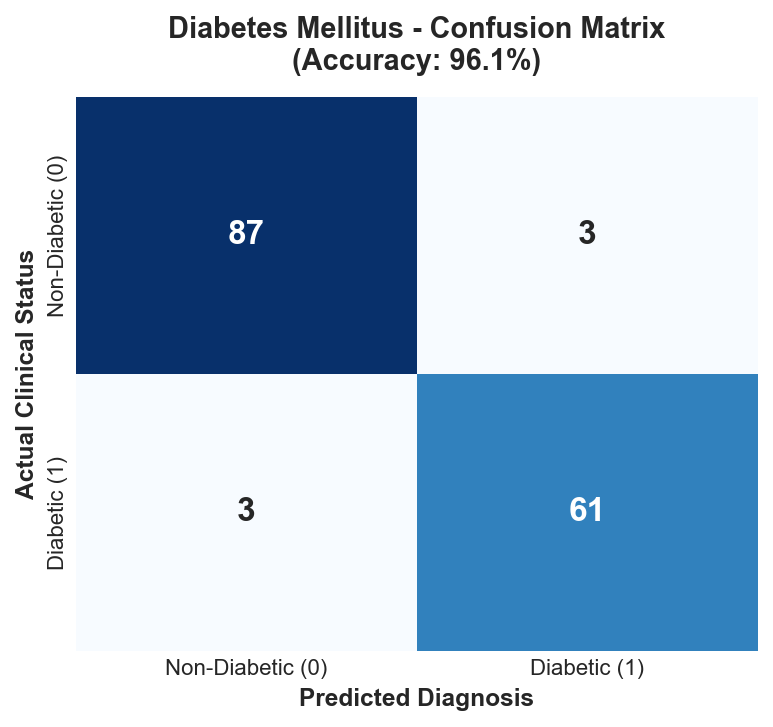
diabetes Confusion Matrix

Biomarker Feature Importance
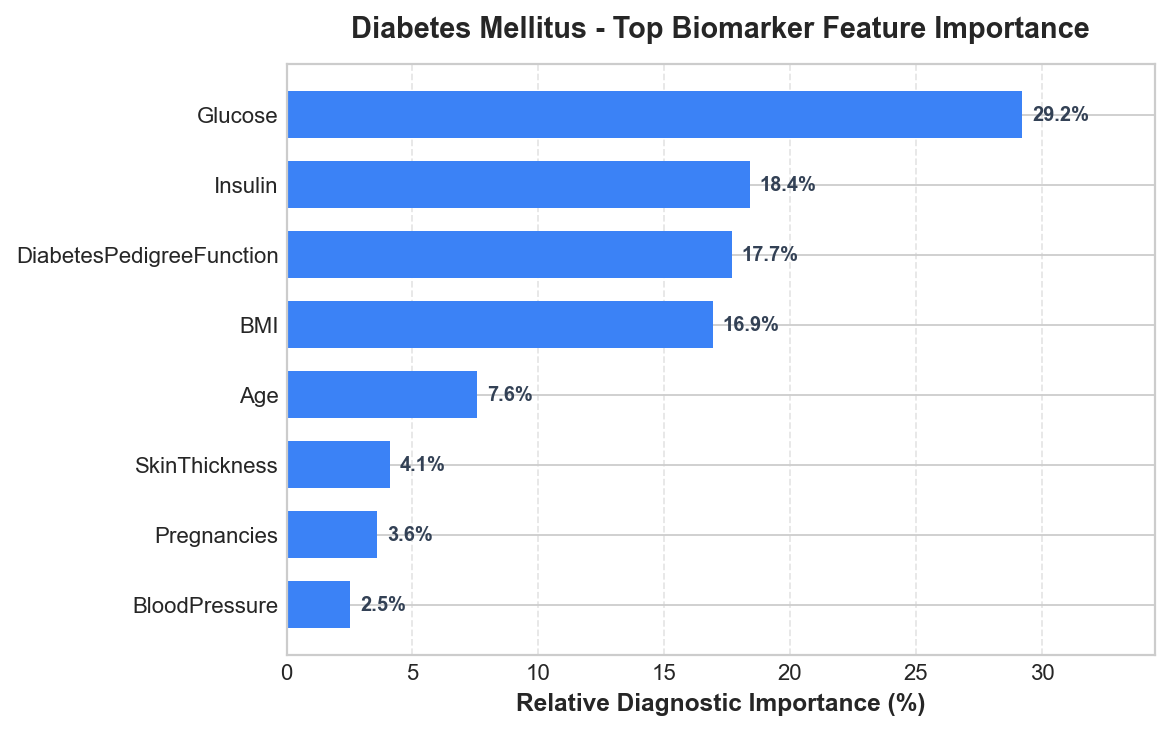
diabetes Feature Importance

ROC Curve (RF vs SVM vs Ensemble)
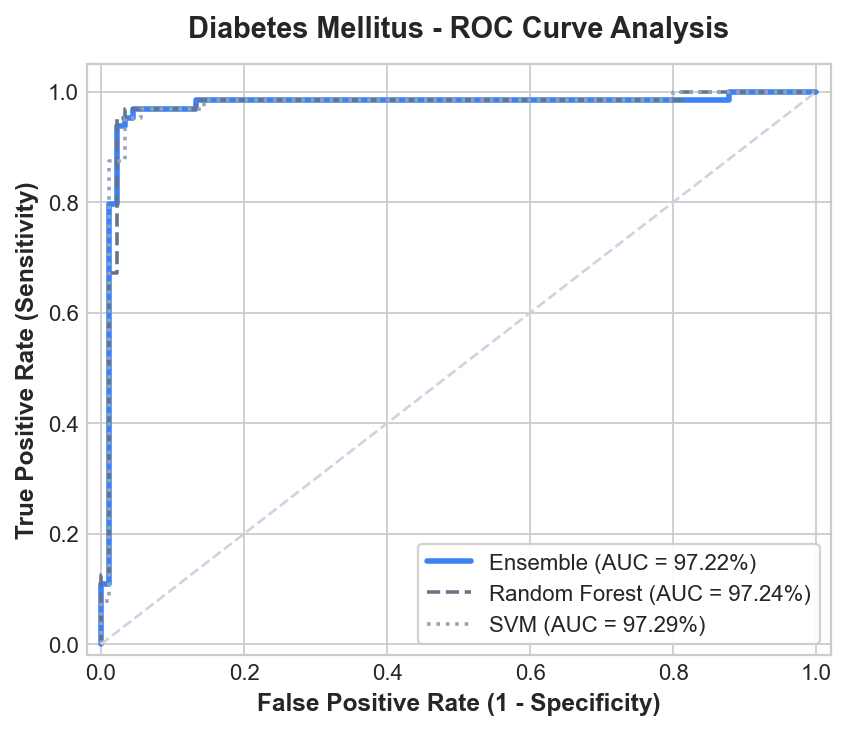
diabetes ROC Curve

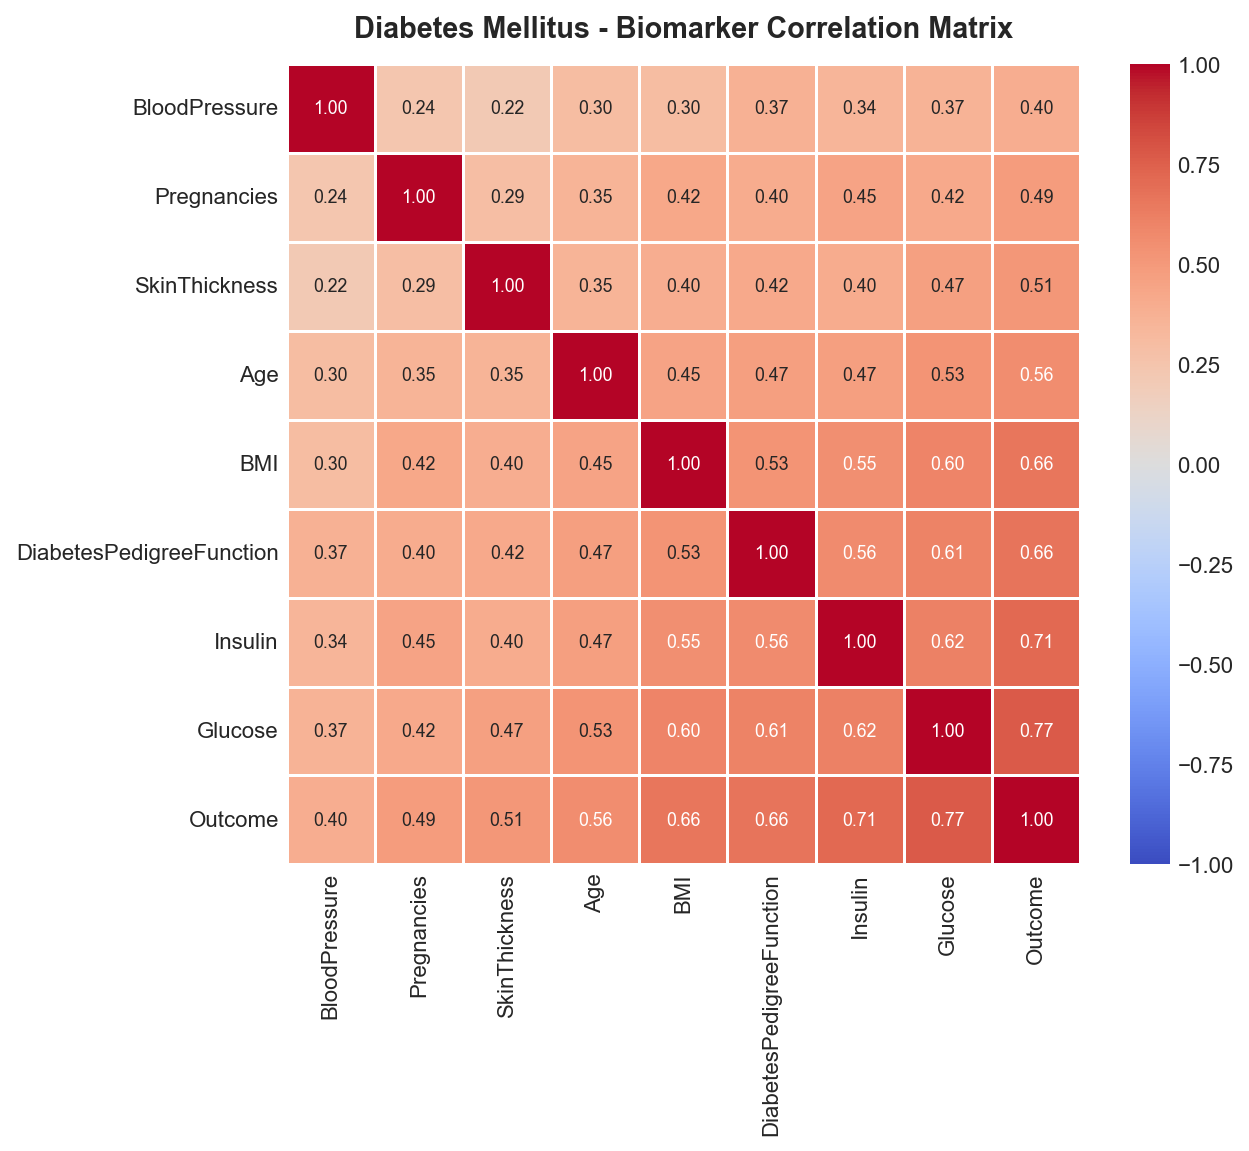
Feature Correlation Heatmap

diabetes Correlation Matrix

🧠 Parkinson's Disease — Verification Metrics & Diagnostic Plots

Ensemble Accuracy: 97.5% • Precision: 100.0% • Recall: 95.92% • F1-Score: 97.92% • ROC-AUC: 97.7% • 5-Fold CV: 98.25% (±1.0%)

Confusion Matrix
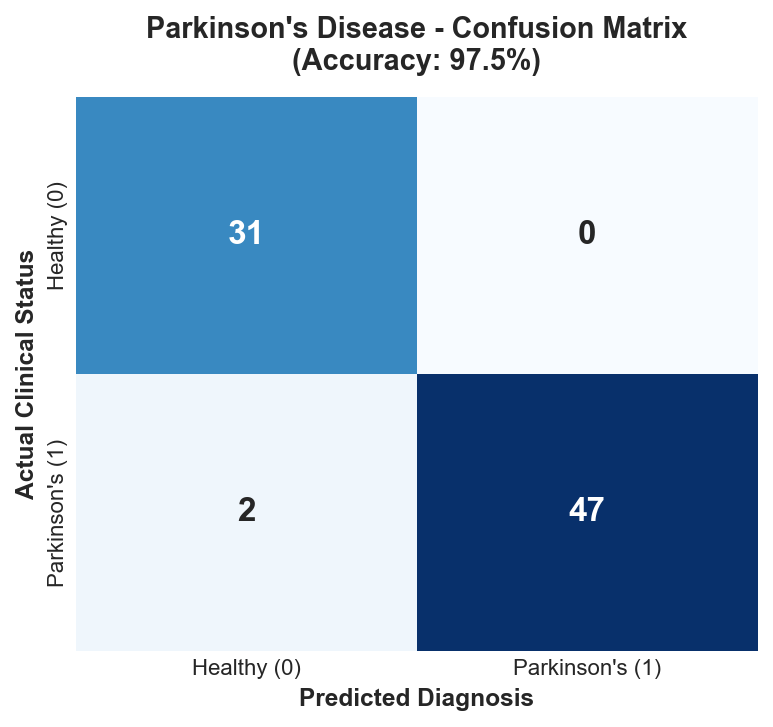
parkinsons Confusion Matrix

Biomarker Feature Importance
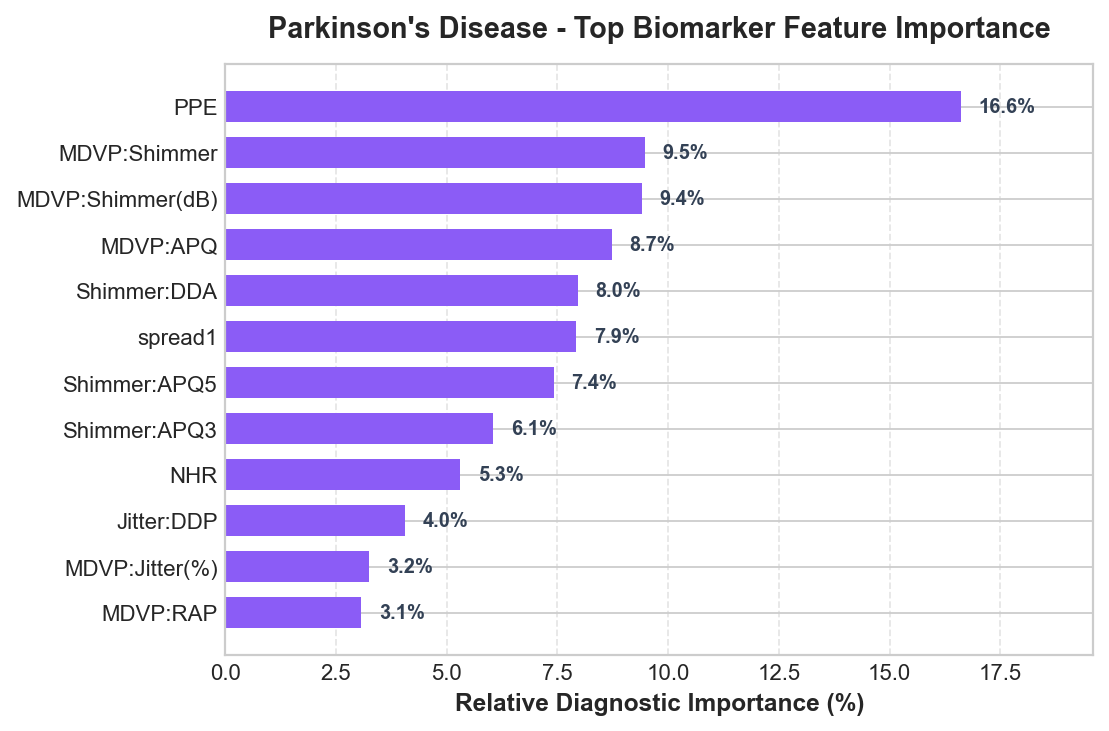
parkinsons Feature Importance

ROC Curve (RF vs SVM vs Ensemble)
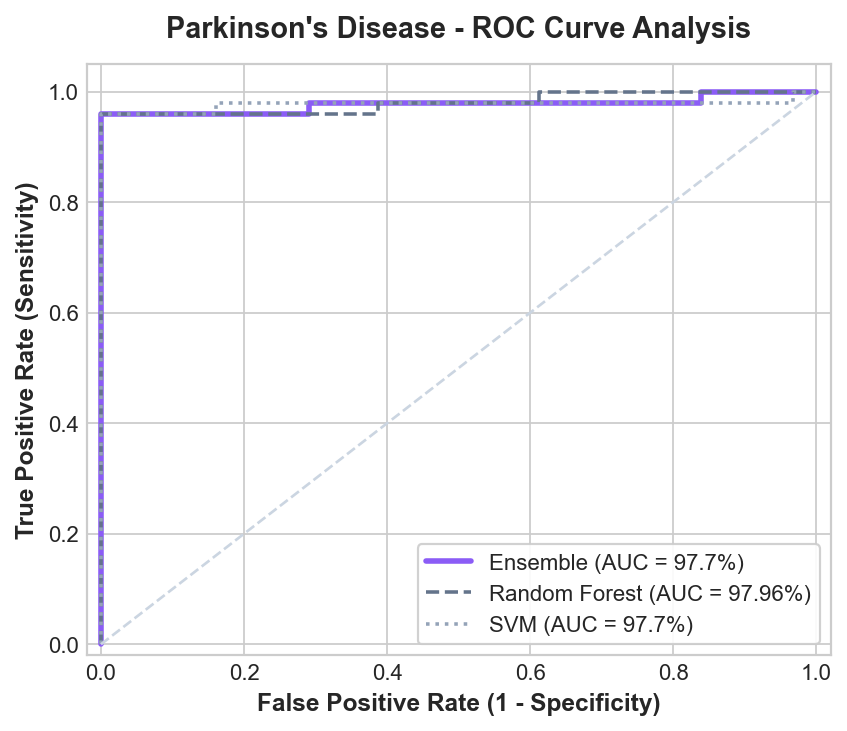
parkinsons ROC Curve

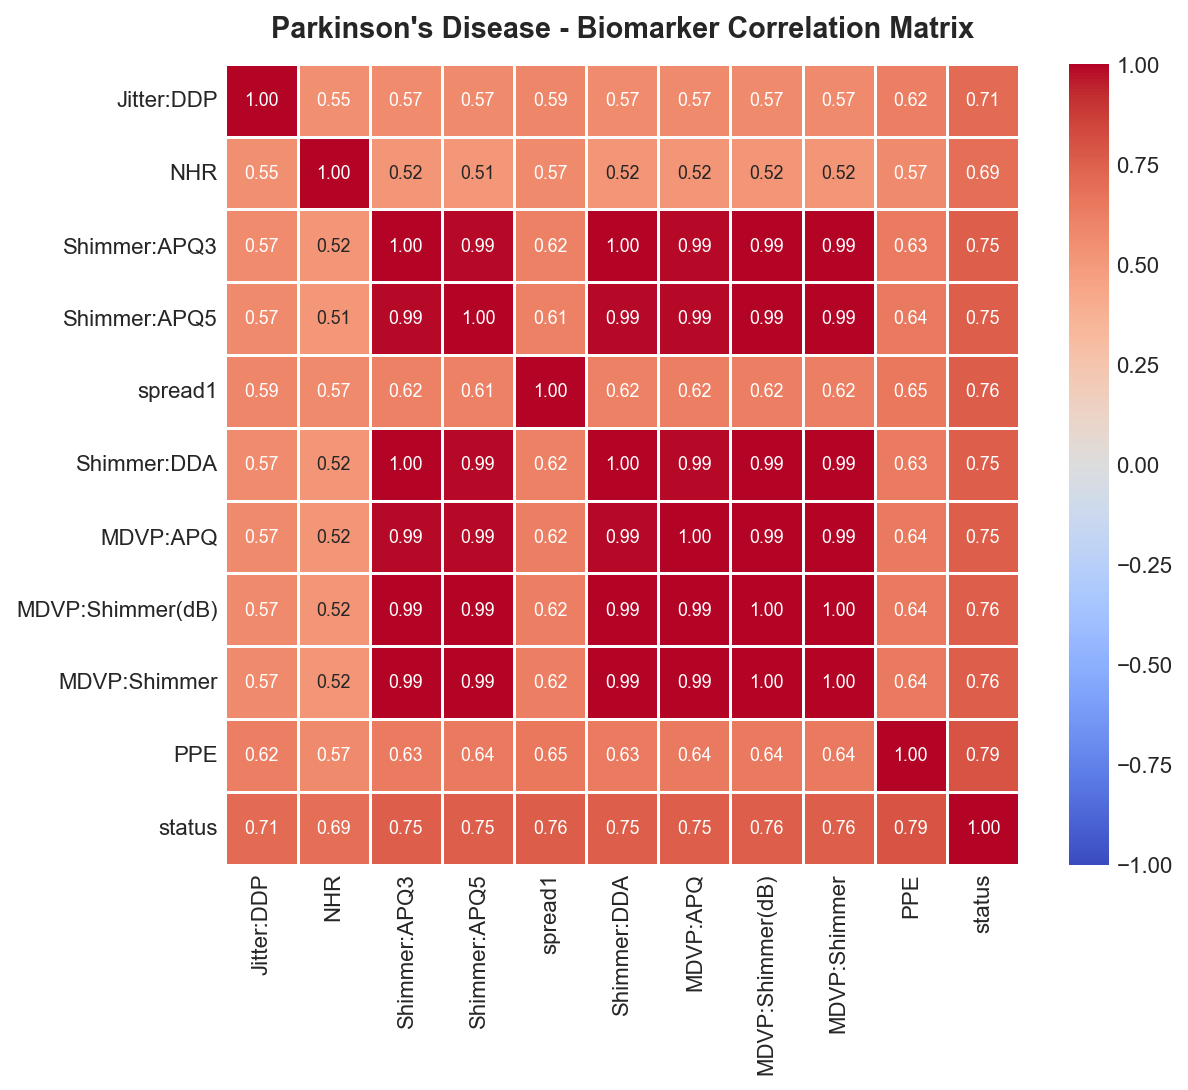
Feature Correlation Heatmap

parkinsons Correlation Matrix